|
This article applies to:
|
These are distinct from your Services Used Ratings, which are scores guests have given for drill-down questions on your surveys, or for services or amenities specific to your property (e.g. golf course or horse
riding facilities).
You will see some of the main Primary Service Ratings as a section on your Dashboard and you can find more detail in the Primary Service Rating Report.
What does the Primary Service Rating Report Show me?
Primary Service Ratings help you determine exactly which areas of your property are performing well and which areas guests may feel need some improvement.
Tip: make it even easier to spot under- and over-performing areas by setting targets.
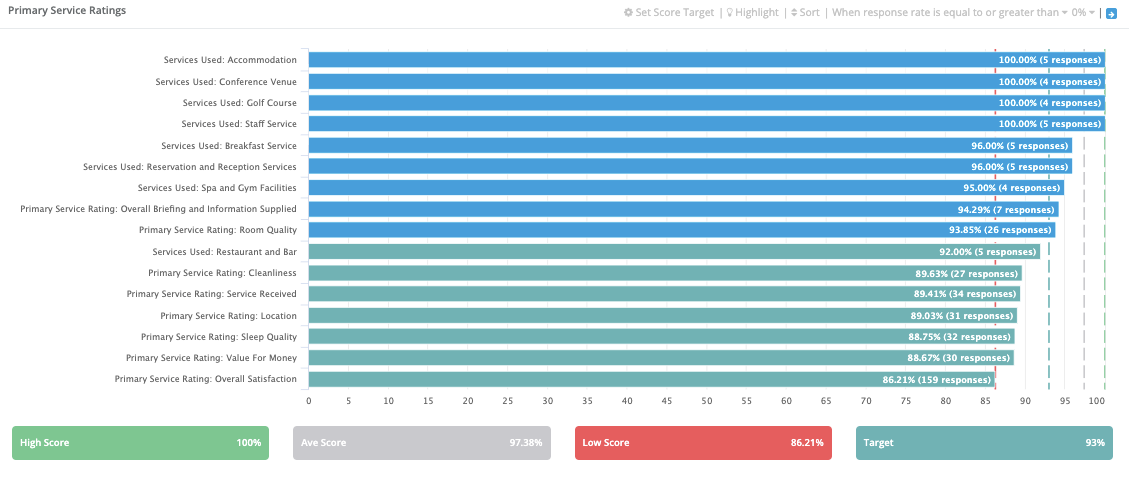
For example, your report could show you that your reception staff are doing incredibly well with the highest score, but your guests' are giving sleep quality a consistently low score. This immediately shows you that your budget might be better spent on new mattresses or pillows than on staff training. Make sure that you use a long enough date range to see areas consistently getting low scores.
To view your full Primary Service Rating Report:
- Click on Reports on the left-hand menu
- Click Service Ratings
OR
Click the blue “more” arrow in the Primary Service Ratings section of your dashboard

You will see the Primary Service Rating table as it is presented on the dashboard, underneath this table, the data will be segmented into specific areas such as Room quality, etc. These area-specific sections will be populated mainly from guests who have provided low scores on these areas and therefore have been asked more questions in your GuestRevu survey.
This can be a lot of information to digest at once, so there are a few ways you can change how you view your primary service ratings to make it easier to process the data
Highlight: Highlight Service ratings or Services used on the graph.
Sort: Change how service ratings are ordered, from lowest to highest or highest to lowest.

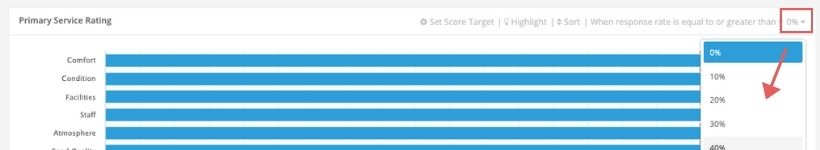
Response Rate Percentage: By default, your service ratings are based on whether the response rate for a certain question is greater than 0%. This means that ratings for all questions will be shown, even ones that may not have been answered by all guests. To change this, select the minimum or maximum percentage of guests you want to have answered the question in order for it to be shown by selecting the percentage value and then selecting equal to or greater than or equal to or less than.
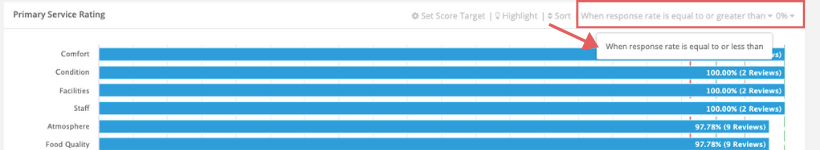
For example, you may want to exclude ratings for questions that are only visible to guests who have given low scores, as this affects the average ratings for these questions because they are only visible to unhappy guests.
These small changes to the way your data is displayed can help you understand what areas need the most improvement and which areas are performing really well.
For Account Groups
The Primary Service Rating Report will consolidate all the properties’ scores together for each rating, this is great when looking at brand consistency and areas the brand can improve on as a whole. Once you have identified the areas you would like to focus on, use the Leaderboard report to see the performance of each property in the group in that specific area.
Top tip: now you know which areas are doing well and which need improving, you can use your Advanced Filters along with Comprehensive Reports comment sections to get a clearer understanding of what changes need to be made and where. Once you’ve made the changes, see how they have affected your guest satisfaction scores by using the Trend Report with Milestone Markers.