This can be particularly useful in defining your target market, tracking the impact of operational changes and pinpointing areas for improvement. If you want to track the impact of operational changes, enhance this report by adding Milestones.
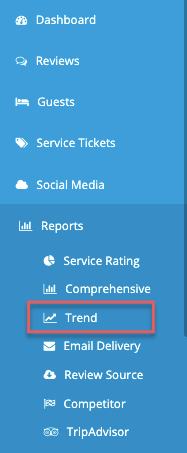
You can find your Trend Report by clicking on Reports in your left-hand menu, and then selecting Trend.
|
This article relates to:
|
Your Trend Report is divided into four separate tabs: Overview, Primary Service Ratings, Services Used Ratings, and Other.
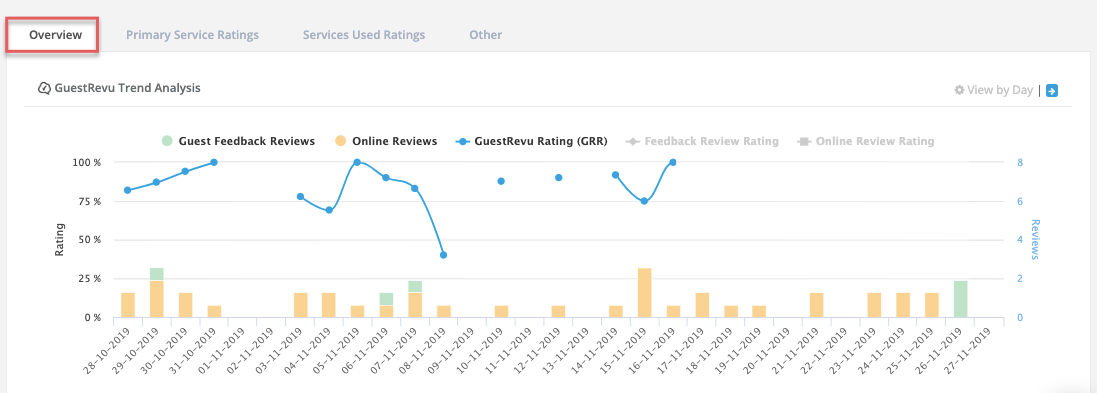
The Overview tab will include the following graphs for the date range that you have selected:
- GuestRevu Trend Analysis, which shows you trends in your overall guest feedback, online reviews, and GRR. Find out more about how your GRR is calculated here
- Net Promoter Score, which shows you how many promoters, passives and detractors you have received, as well as indicating how your NPS has increased and decreased over time. Your NPS is based on the question: “How likely would you be to recommend us to family and friends?”. Learn more about your NPS here
- Sentiment, which shows you how many positive, negative and neutral reviews you have received based on keywords and basic semantic analysis, and how your sentiment score has increased and decreased over time. Read more about sentiment analysis here
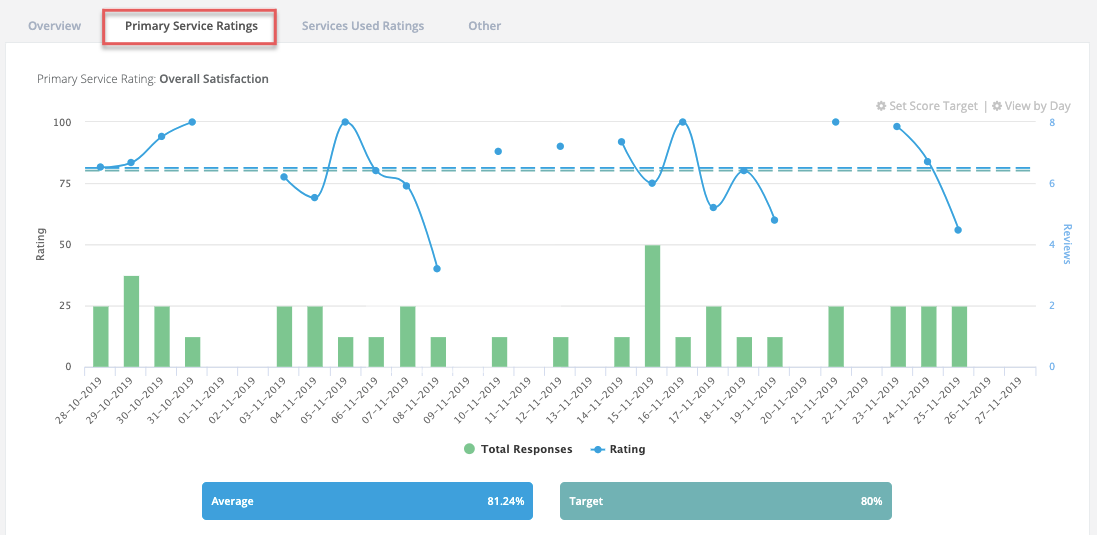
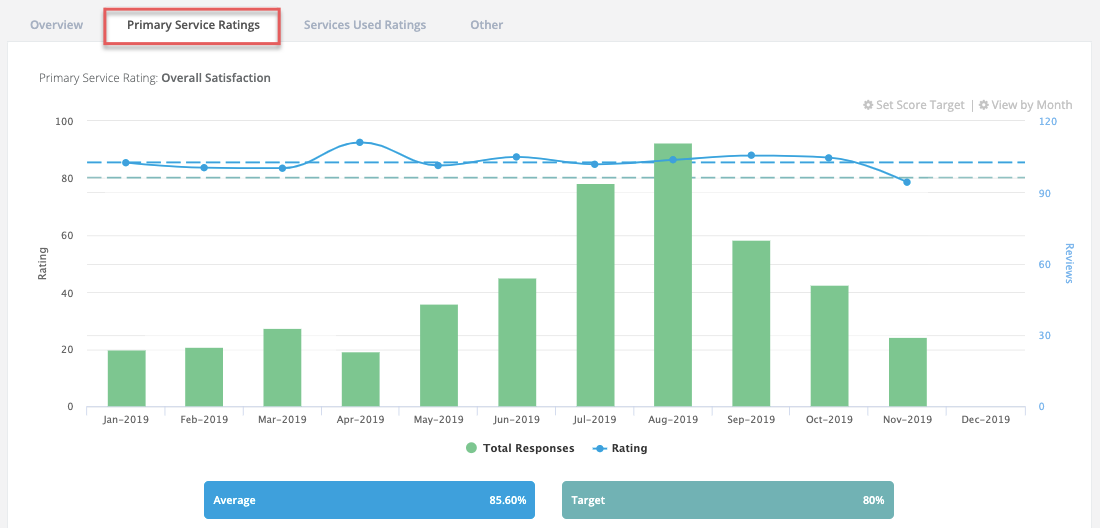
The Primary Service Ratings tab will include graphs for each of your Primary Service Rating questions, reflecting how many responses you have received for each of them, and how your average scores for those questions have increased and decreased over time. This will include questions such as Overall Satisfaction, Value for Money, Location and more.
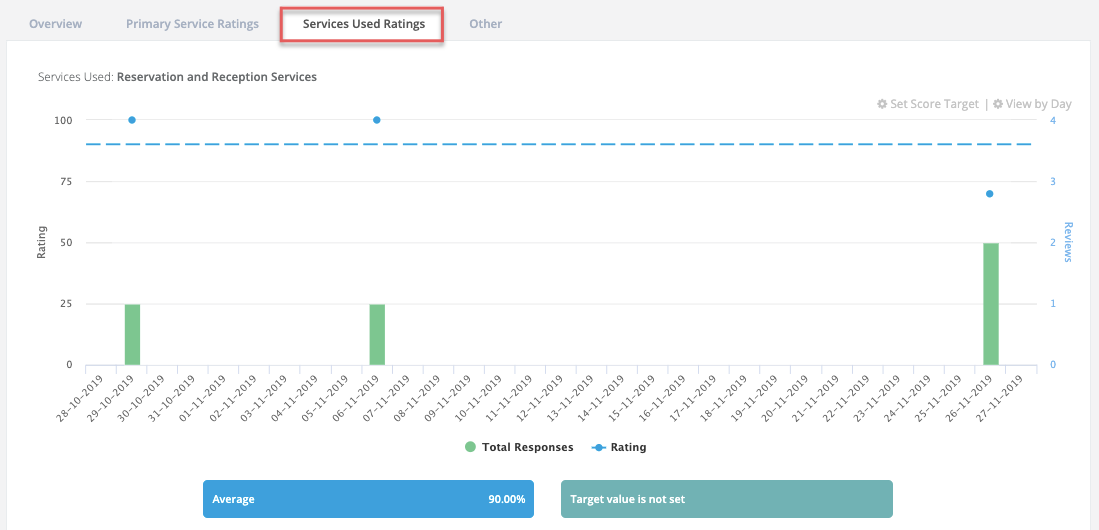
The Services Used Ratings tab will include graphs that indicate which areas of your property are visited most often, and will indicate how the average scores for these areas have increased and decreased over time. This will often include areas such as Reservation and Reception, Accommodation, Restaurant and Bar, Spa and Gym and more.
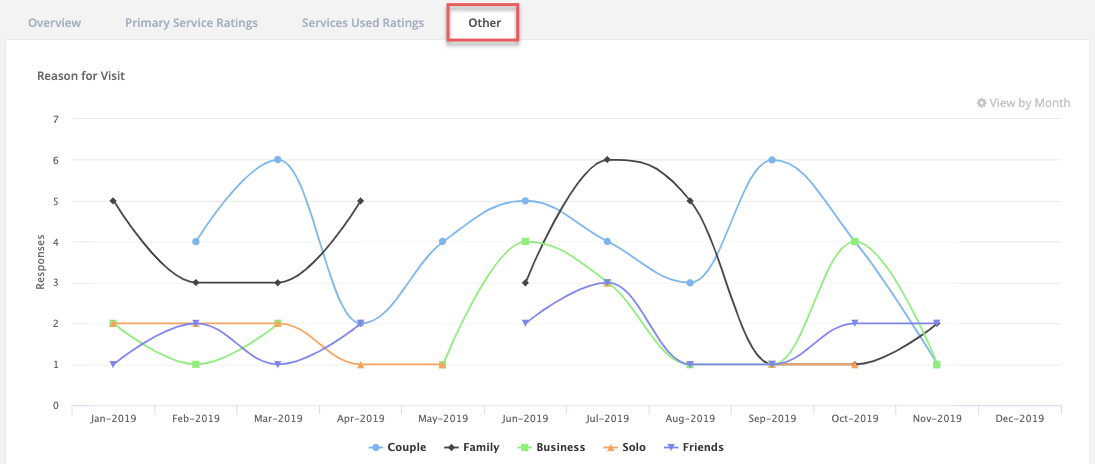
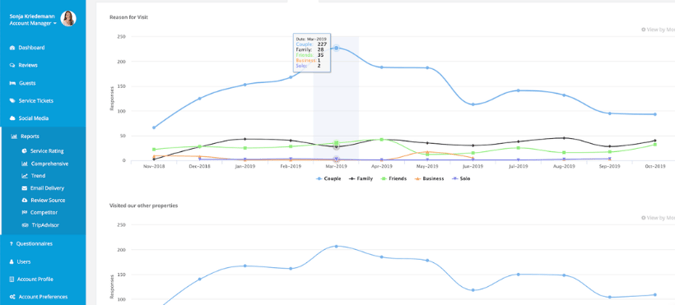
The final tab under your Trend Report is named Other. Here you can find data for any questions in your survey that are not scored on a rating scale – questions like “How did you hear about us?” and “Where are you from?”
Examples of how the Trend Report can be used
In the example below, responses to the question: “Reason for visit” show that the majority of guests during the selected date range were couples, rather than families or solo travellers.
This information could be used to refine the packages that you offer to couples over particular times of the year, or help you to provide your guests with more details relevant to couples in your marketing materials.
In another example, shown below, Overall Satisfaction responses and scores are shown, and the hotelier can see that August saw the most responses, but there was no significant change in rating. This indicates that August was the busiest month for this hotel, but the team managed to maintain overall satisfaction.
A target score is also indicated to show the satisfaction rate that the hotelier hopes to achieve, and they could see that November is the only month during which this target wasn’t reached or exceeded, so hotel management may want to read some of the reviews from November in more detail to see what went wrong. Learn more about setting targets for your account.
Refine the trend report based on Milestones
If you are taking note of the properties’ and teams’ Milestones, they will be visible on this report so you can see the impact of changes by comparing scores before, during and after changes have been made. Ensure you customise your date range to include before, during and after changes.
Top Tip
To understand how your property is performing, you need to be able to see your progress over time, but it’s also great to have some industry benchmarks – a lot has changed in hospitality since 2019!