This report is an incredibly useful tool to determine which properties in your group are performing the best and which properties are falling behind compared to each other.
|
This article applies to:
|
Your Group Leaderboard Report can help you ensure brand standards are met across all properties and departments using insights from your surveys and online reviews.
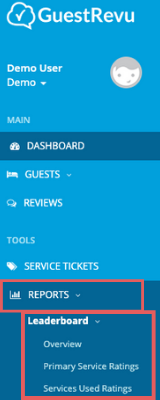
How do I find my leaderboard report?
- Log in to your GuestRevu account at http://my.guestrevuapp.com
- Open the Account Group for which you would like to see the Leaderboard Report (Find out more about creating and managing Account Groups here).
- Click on Reports > Leaderboard
- Select which report you would like to open you have the choice of Overview, Primary Service Ratings or Service Used Ratings
Understanding your Leaderboard Reports
Your group leaderboard report is separated into three sections: Overview, Primary Service Ratings and Services Used Ratings.
The Overview Tab
This section will show you how your properties compare against each other for:
- Number of Reviews
- Review Rating
- Sentiment
- Net Promoter Score (this is only applicable if you are using surveys, find out why direct feedback is important here.)
Why is the Overview important?
This section combines survey and online review data to provide an indication of how the properties are performing overall. For example, a property may have the highest volume of reviews, but that doesn't mean they have a high rating in those reviews. The overview allows you to see all the important figures side by side. Note: To segment this data further, use advanced filters or filter by review source.
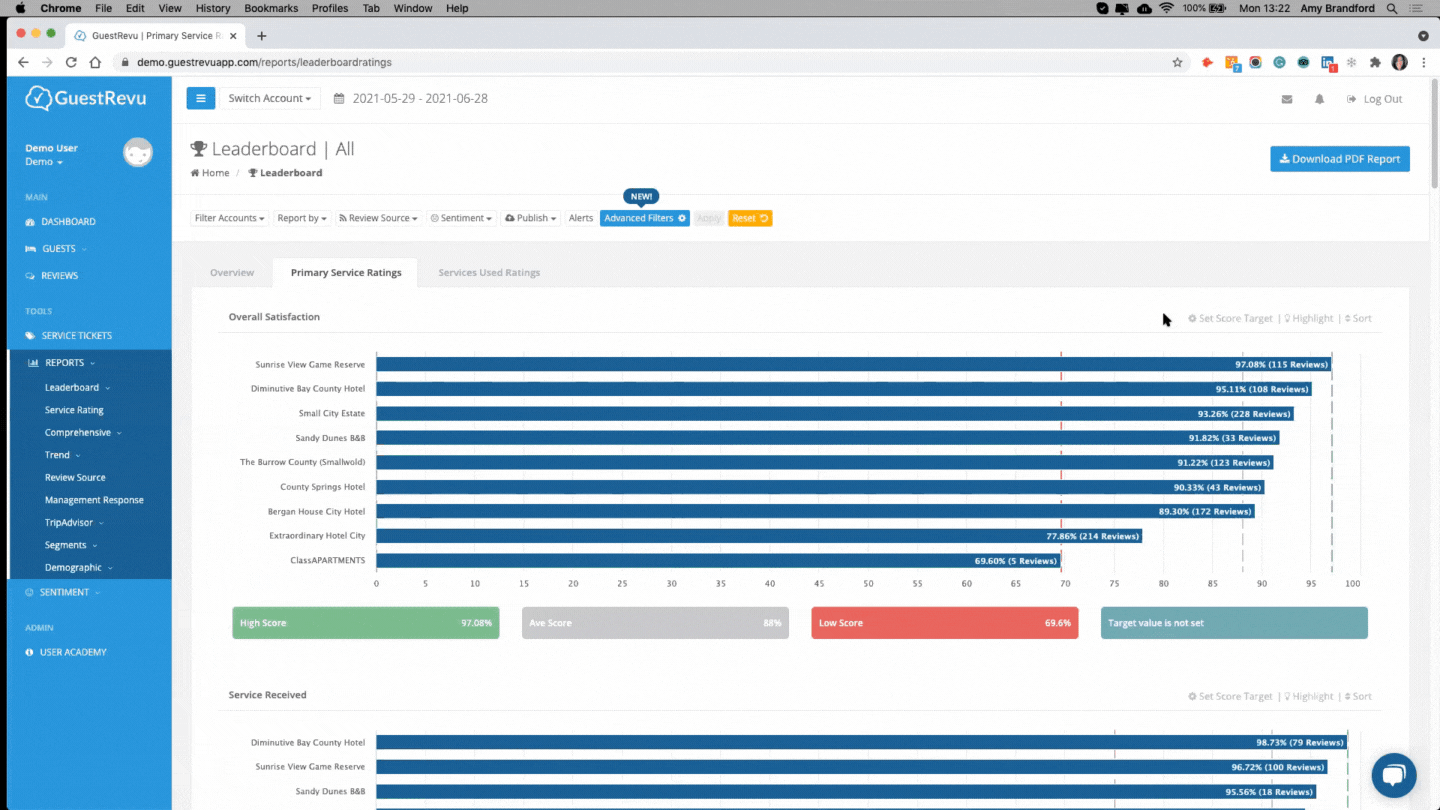
The Primary Service Ratings tab
This tab will show you the scores for primary service questions. These are the main questions in your survey and the questions generally asked by online review sites. These questions can vary depending on where guests are leaving feedback. The most commonly completed questions are:
- Overall Satisfaction
- Service Received
- Cleanliness
- Value for Money
- Location
Depending on where your reviews are coming from, you may also see:
- Room Quality
- Sleep Quality
- Condition
- Facilities
- Comfort
- Atmosphere
- Food Quality
- Staff
Why are the Primary Service Ratings important?
Primary service questions cover the facilities that almost all properties offer, and therefore provide a uniform scale on which they can be compared. For example, not all properties in your group will receive scores for horse riding, safaris, or spa, because they don’t all offer these facilities, but scores like overall satisfaction, value for money, and location are universally relevant.
This breakdown of the different areas within the properties also allows you to see where each property’s strengths and weaknesses lie. Some properties may perform high in areas such as Service but Low in areas such as Room quality. This can help you allocate the right training or budget to the right properties in the right area.
Services Used tab
This offers a comparison of more detailed and customised questions from your surveys (e.g Receptionist knowledge and friendliness). These will depend on what questions you have in your customised surveys (Need to customise your surveys? Complete the survey changes request form).
Why are the Services Used Ratings important?
These custom questions can provide highly relevant and brand-specific insights. For example, one client asked, “Would you rent a gaming console for the duration of your stay if you were to quarantine again?”. Based on these answers you can make informed, data-driven decisions.
Customising and filtering how data is displayed
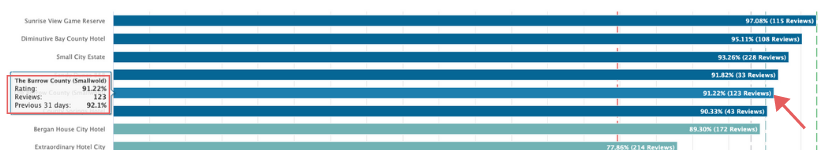
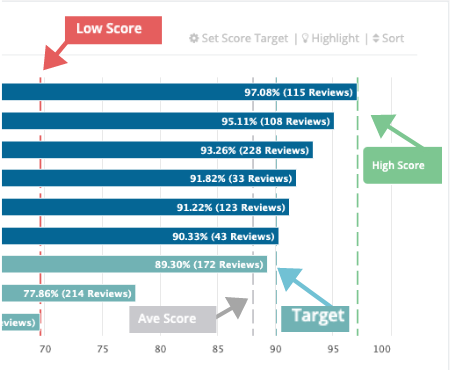
The Leaderboard Reports are a series of graphs showing the performance for each of the properties on each question. You can see the average score for each property, as well as the number of reviews that answered the relevant question within the date range you have selected no matter which tab, section or graph you are looking at on the leaderboard Report, as shown below:
There are a few ways in which you can sort them and arrange the graphs on your Leaderboard Report to find the insights you are looking for more easily.
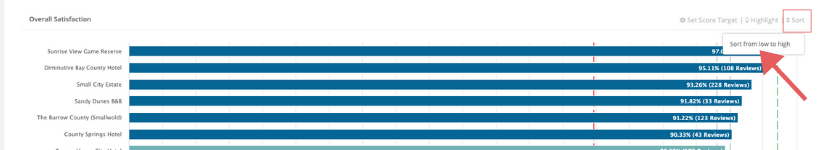
Sort by score
By default, each of the bar charts will display the highest-ranked property at the top and lowest at the bottom. If you would like to change this view to rank from lowest to highest click the Sort button top right of each section. This allows you to see which property is performing the best and who may need some assistance to improve their scores in certain areas.
Set targets
You can set target scores for each of the rating criteria on your reports, and properties that do not meet this score will be highlighted. To set a target for a question:
- Click on Set Score Target
- Add your desired Score
- Click update
Any properties falling below the target score will be highlighted in teal as shown below:
Each bar chart also has different colour lines, which are used as a guide to see how properties lower down or in the middle compare to the highest (green), average (grey) and lowest (red) scores. The target score is shown in teal.
Take properties out of the Leaderboard Report
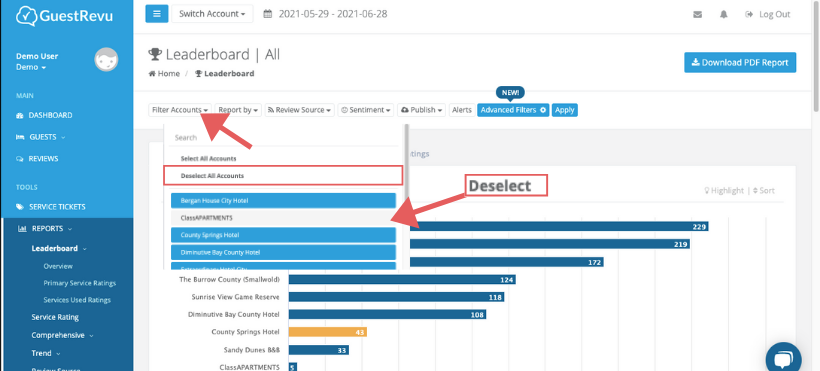
You may, at times, want to exclude a property or a number of properties from your report, for example when a hotel is undergoing refurbishment.
- Click Filter Accounts. A dropdown listing all the properties in your account group will appear. All properties included will be highlighted blue
- Click on the ones you don’t want to include, then click on the blue apply button on the right. The properties NOT highlighted in blue will then be deselected and the updated report will load. You can also deselect all properties and just select the ones you do want to include or compare.
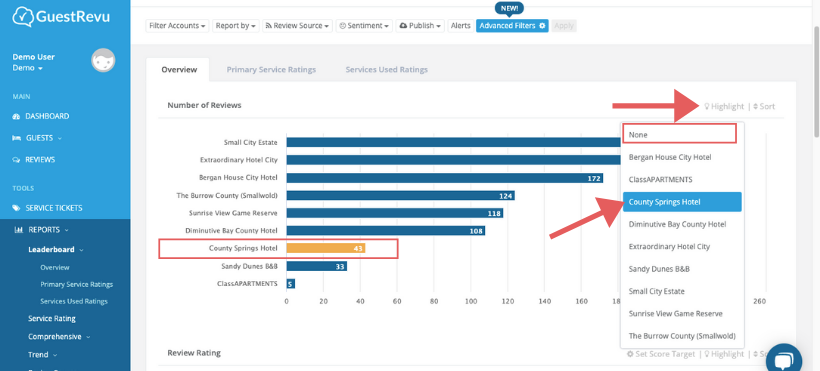
Highlighting a property
There are many reasons you may want to highlight a certain property in the Leaderboard Report. For example it may be new to the brand, or have a new general manager, or a GM of a particular property may wish to view the group report with their own property highlighted.
To Highlight a property:
- Select Highlight the top right of any graph
- Click on the name of the property you would like to highlight, the report will automatically update
To remove the highlight, click Highlight and select the option None at the top of the dropdown
Note: You can only highlight one property at a time
More Advanced data filtering
If you want to slice and dice the data even more, try using Advanced Filters or filtering by Review Source.
Exporting the data
If you have filters set on the report and want to download the data, click the Downloads PDF Report in the top right-hand corner this will download the report with the criteria you have applied. If you have no filters, score target or have not highlighted a property the data will download as displayed.
How do I get Account Groups?
You may have several individual accounts using GuestRevu LITE or CORE. To create account groups, you will need to upgrade to GuestRevu GROUP.
Top Tip
The Leaderboard Report can be a great way to motivate and promote healthy competition between the properties and teams. Think outside the box to keep your team on track and your brand scores high!