This report will display an average of your ratings, management responses, number of responses, and more, according to how you prefer to segment your data.
Note: these dates shown have no impact on the pre-selected date range above and will automatically select a full calendar month
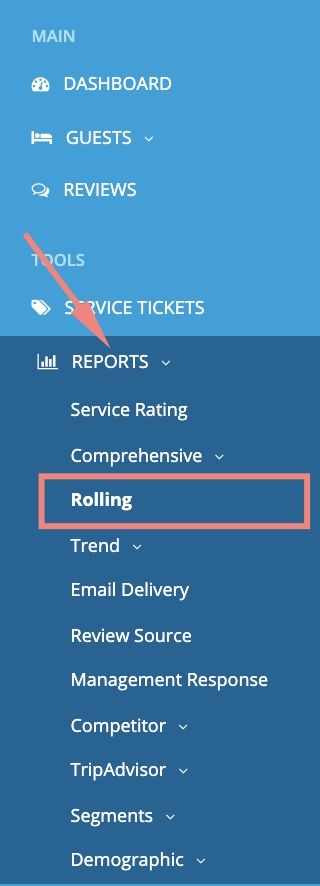
How to find your Rolling Report
- Log in to your GuestRevu account at
This article relates to:
- PRO
- GROUP
https://my.guestrevuapp.com/ - Select the property that you would like to see the Rolling Report for
- Click on Reports > Rolling
Here you can compare your data for the previous four periods, whether it is a week on week, month on month or for the previous four quarters.
Each period will show a percentage average and number of responses for your ratings and scores, as well as how these compare to the previous period.
A red arrow shows your ratings or scores have dropped compared to the previous rolling period
The green arrow shows an increase compared to the previous period.
The blue lightning bolt indicates no change compared to the previous period.
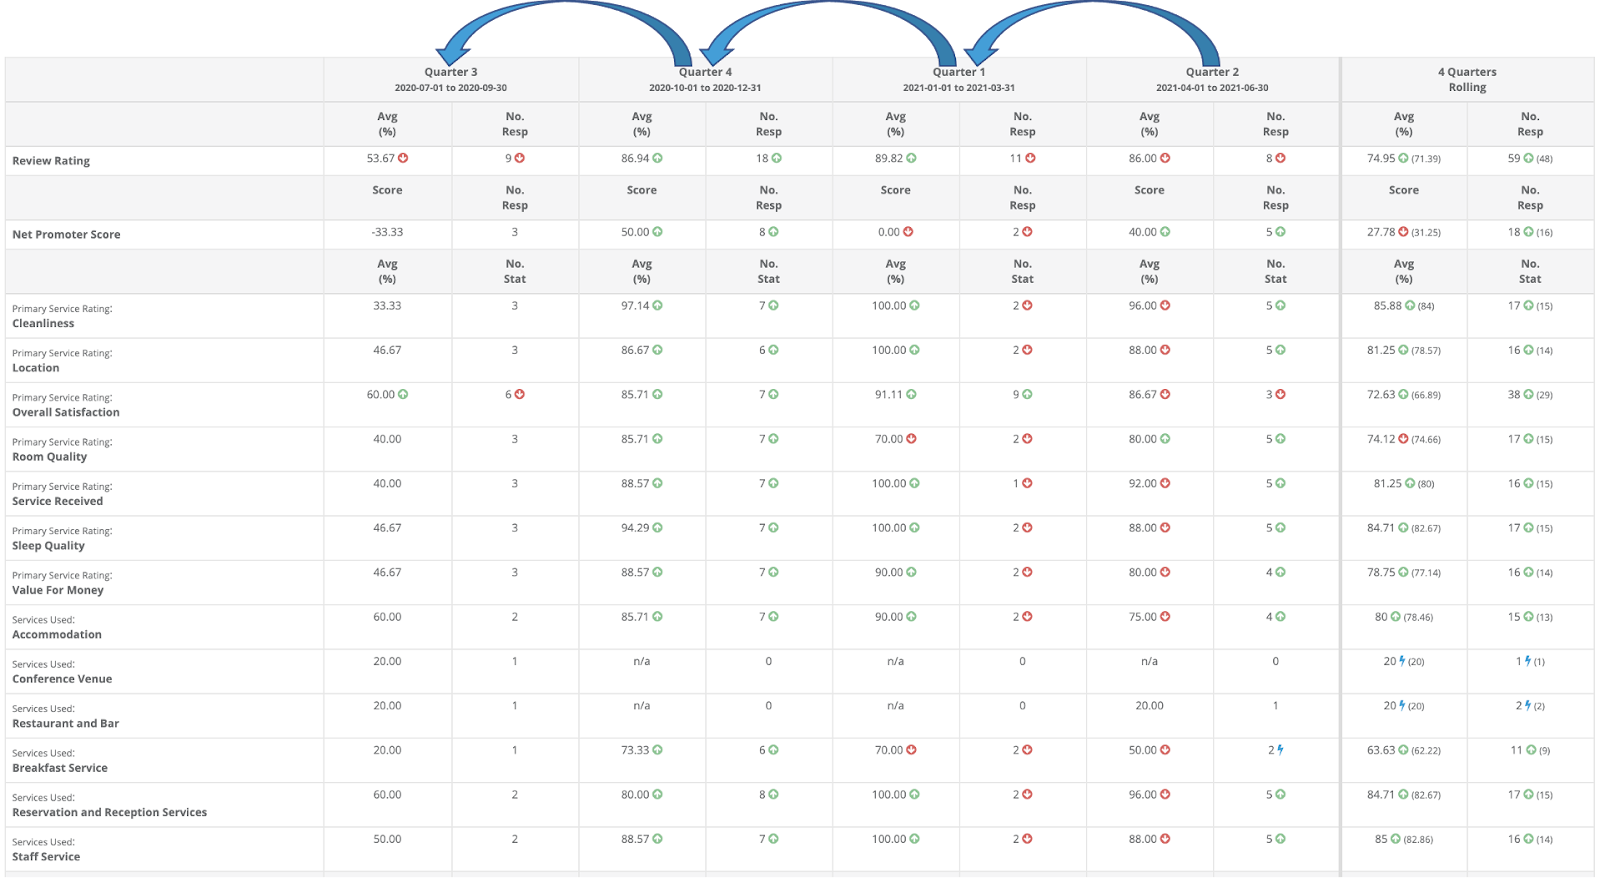
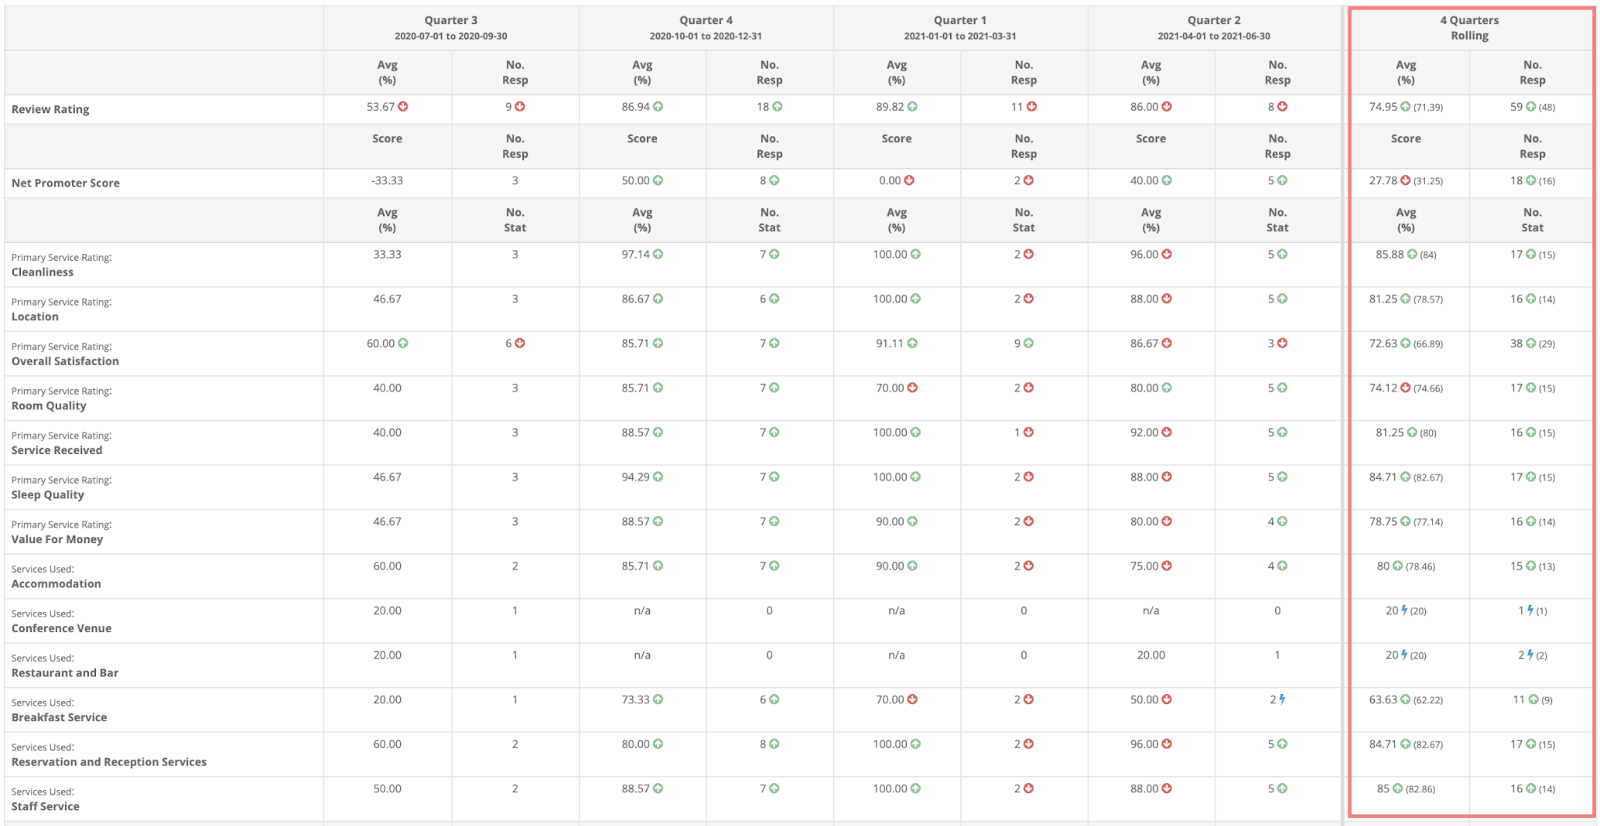
The period on the right displays the combined average and amount of all previous four periods.
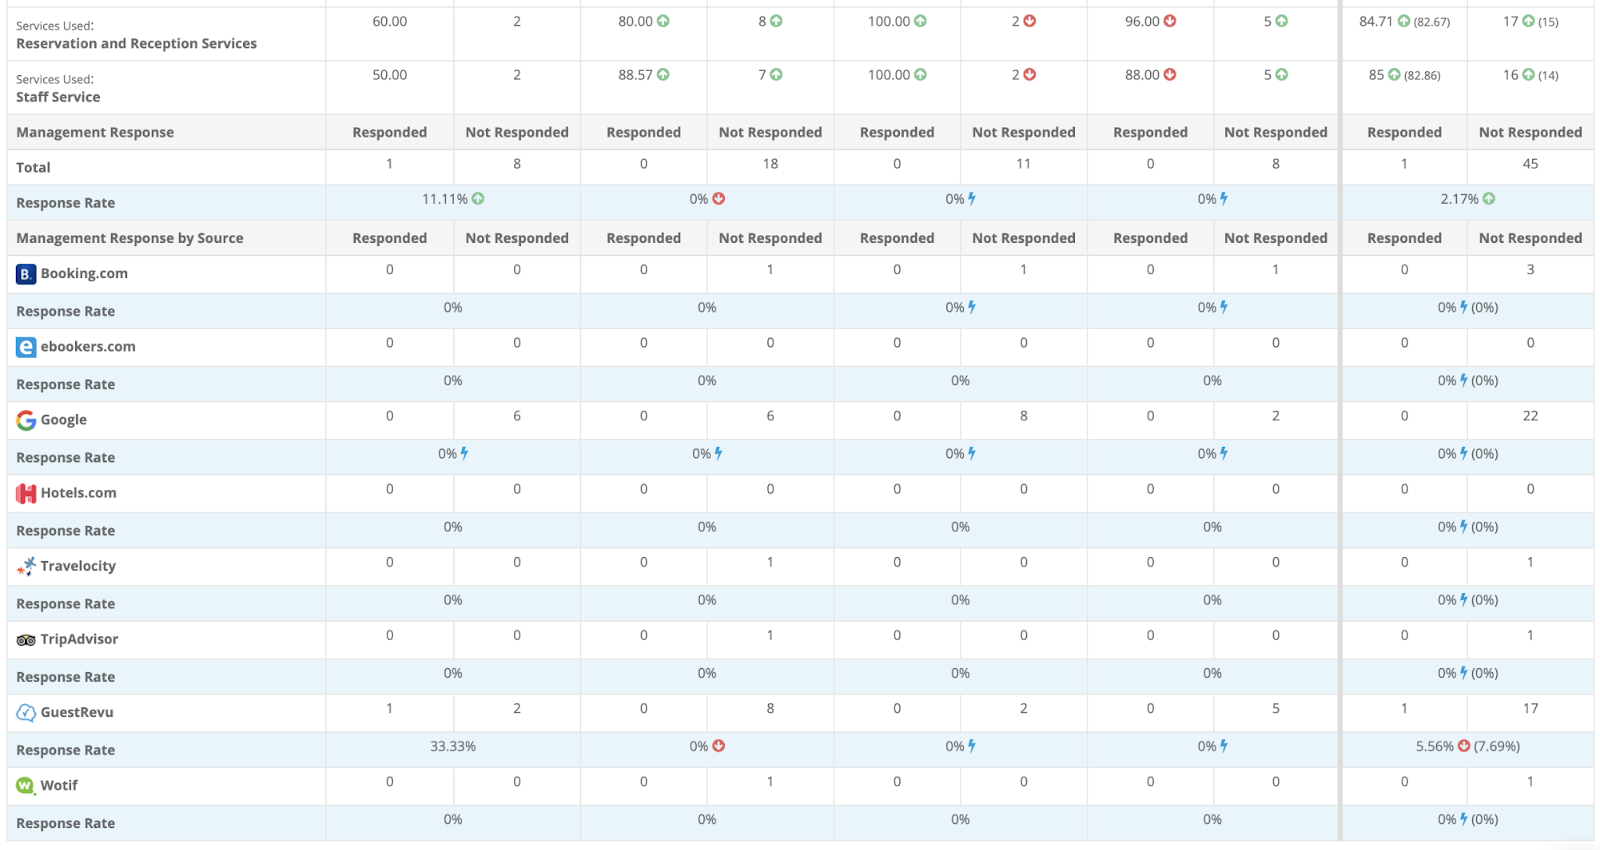
Below the primary services and services used ratings, your management responses for your guest feedback as well as your online reviews are shown. This indicates a total number of management responses against the previous period with a combined total on the right.
Top Tip
Understanding if your scores are getting better or worse compared to previous date ranges can provide context for the weeks, months or quarters ahead. You can use this as an opportunity to get the team together to discuss positive increases in areas and talk about how to best increase scores in others.