This is one of the most detailed reports. It can be filtered for more granular analysis, and is split into the following sections:
|
This article applies to:
|
- Summary & NPS
- Primary Service Ratings
- Service Used Ratings
- Other
- Tables
- Guests Comments
How to find your Comprehensive Report:
- Login to your GuestRevu account at https://my.guestrevuapp.com/
- Click on Reports > Comprehensive
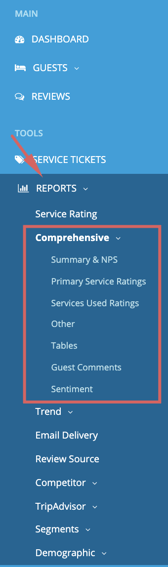
- Select which of the tabs you want to open first. Once viewing any of the tabs, it is easy to navigate between them using the left-hand menu or the tabs at the top of the report
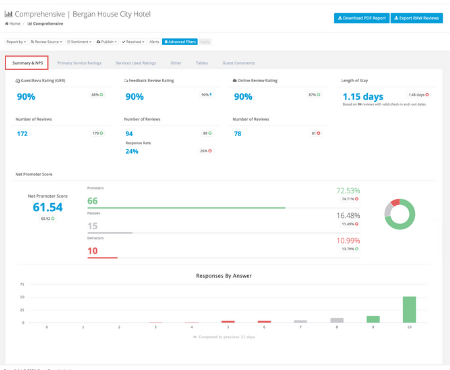
Summary and NPS
This section shows you the main KPIs from the dashboard as a summary with the addition of the guests’ average length of stay as indicated by check-in and check-out dates.
- GRR (GuestRevu Rating)
- Number of Reviews
- Feedback Review Rating
- Number of completed questionnaires
- Response Rate
- Online review rating
- Overall number of online reviews
- Average length of stay
- NPS (Net Promoter Score)
Primary Service Ratings
Your primary service ratings are the main questions asked on your questionnaire and by most online review sites, such as “overall satisfaction”, “room quality”, etc. You can separate the different sources by using the filters (we will show you this further down).
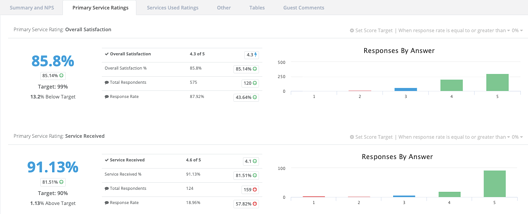
Each question's ratings will be broken down into more detail. You will be able to see exactly how many guests gave a certain score or response, and what that equates to as an average.
In the example below, you can see that Overall Satisfaction has an overall rating of 98.76%, which means that the average score is 4.9 out of 5. This is based on 177 respondents, which means 32.96% of the total number of guests who completed the survey answered this question during the selected date range.
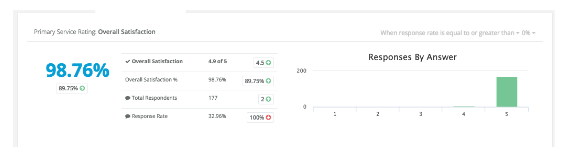
The graph to the right-hand side shows which scores are given most frequently for that particular question. In this example, we can clearly see that the majority of the guests gave a rating of 5 for overall satisfaction.
Services Used Ratings
The Services Used Ratings are based on the remainder of your questions on your questionnaire such as reservation and reception services, staff service, breakfast service etc. These will generally only show for guests who gave low scores on the primary service rating and were therefore asked more questions on that specific area. This report is highly valuable when looking for areas that may need improving.
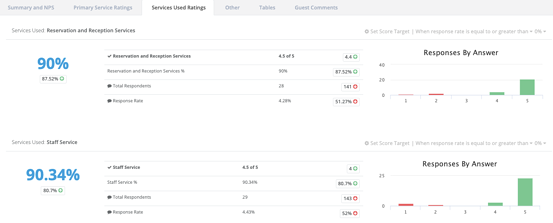
The graph displays the information about your Primary Service Ratings tab.
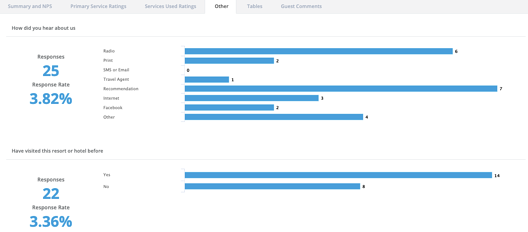
Other
These are all your additional questions that do not have score or rating answers, such as “What sort of trip was this?”.
On this report, you’re able to see how many of your guests answered what for each of these questions. This report is especially useful for marketing purposes. As you can see in the example below “How did you hear about us?”, at a glance you can easily determine which of your marketing methods have the most impact, in this example, “Recommendation” is the most popular choice for how this hotel’s guest’s heard about their property.
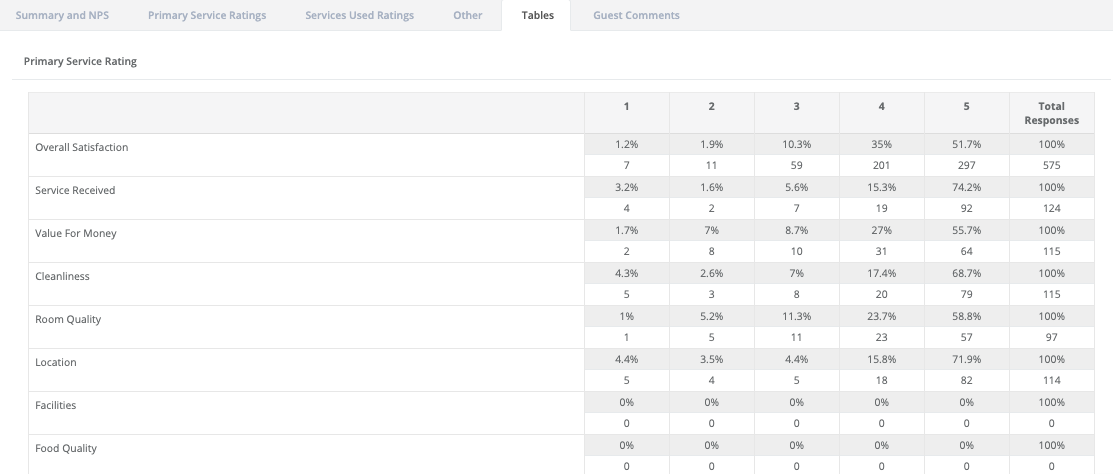
Tables
This section of your report is a breakdown of all your survey questions and online review questions in table format. For example, you can see that 297 guests rated a 5 on overall satisfaction, which means that 51.7% of the guests gave the property a full score whereas 11 guests gave a rating of 2 which makes up 1.9% of the guests.
Comments/Suggestions
This will display all online review comments and any comment responses from guests on your questionnaires. This is a great way to see all comments in one place and even filter this information down by section and keywords. You can download each section's comment and they will automatically be saved to your computer. You can also download a full comments report at the top to view all the comments in one document. To enhance this filtering even more take a look at Advanced Filters.
Filtering options on your report
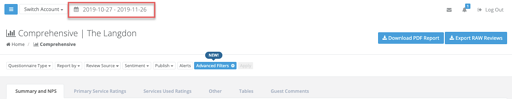
Changing the date range: Click on the dates on the top left side of your screen to select the date range you would like your report to reflect.
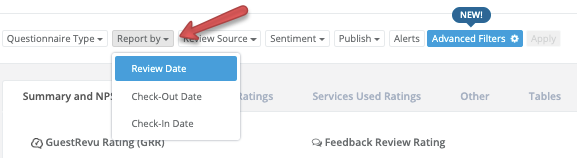
Report By: This changes the criteria the system uses to decide whether a review should be included in your date range or not. You can select to filter by review date, check-in or check-out date. Often you will get slightly different data because of the length of stay and the delay between check out and when the guest actually left a review. By default, this is set to “Review Date”, but you may wish to change this to check in or check out date to see the report based on when your guest actually stayed, rather than when they responded to your questionnaire.
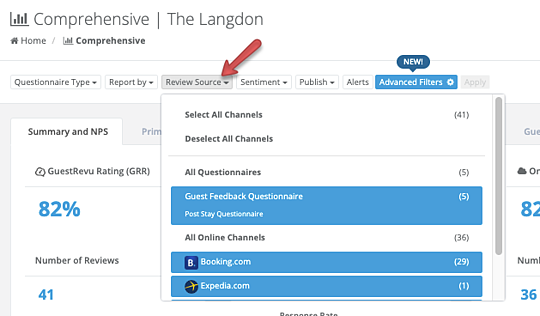
Review Source: This allows you to filter your report based on the platform the review was left on, such as one of your direct questionnaires or specific online travel agencies such as Tripadvisor or Booking.com
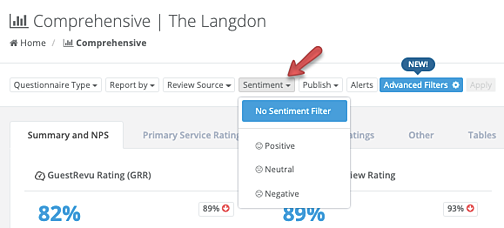
Sentiment: Filter your report based on reviews marked with either a positive, neutral or negative sentiment.
Alerts: Select this to base your report solely on alerts. By default, alerts are triggered when a guest gives you a score of 2 or less (out of 5) on a question from the first page of your questionnaire. You can change the scores that you would like to trigger an alert by contacting support.
Top Tip 💡
Alerts don’t only have to be negative. You can also use alerts to get a notification when a guest gives you top scores on your NPS question, or says that there was a specific member of staff whose service was exceptional.