![GuestRevu-logo-white_no-slogan.png]](https://help.guestrevu.com/hs-fs/hubfs/New%20Logo/GuestRevu-logo-white_no-slogan.png?height=40&name=GuestRevu-logo-white_no-slogan.png)
The Management Response Report provides a comprehensive overview of the number of online and survey reviews that have received responses from your staff, both at the group property level and at an individual property level. It also highlights which review sources have the highest and lowest levels of management responses.
This report enables you to easily identify which properties are actively engaging with reviews and which ones may require more attention, as well as pinpoint any platforms that might be overlooked.
|
This article applies to:
|
Management Response Overview Report for Account Groups
How to find your Management Response Report
- Log in to your GuestRevu Account
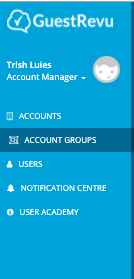
- Click on the “Account Groups” tab in the left-hand menu
- From here, click on Reports in the main menu on the left, then click on Management Response > Overview
Understanding your Account Group Management Response Overview Report
To start off with, at the top of your management response report, you will be shown a couple of key figures and percentages:
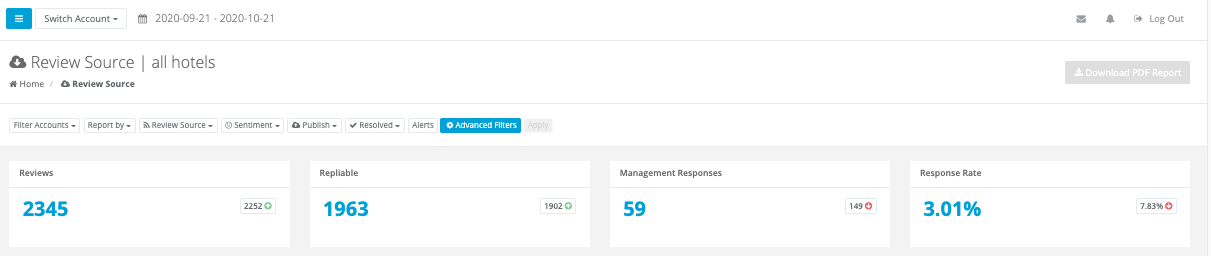
Reviews: Total number of reviews each property received within the selected date range.
Repliable: Number of reviews that can be responded to.
Management Response: Total responses published in the selected date range.
Response rate: % of repliable reviews that received responses.
The “Management Response” table below will show you the number of responses per review source for each hotel. This data is also displayed in a chart to make it easier to read and understand.

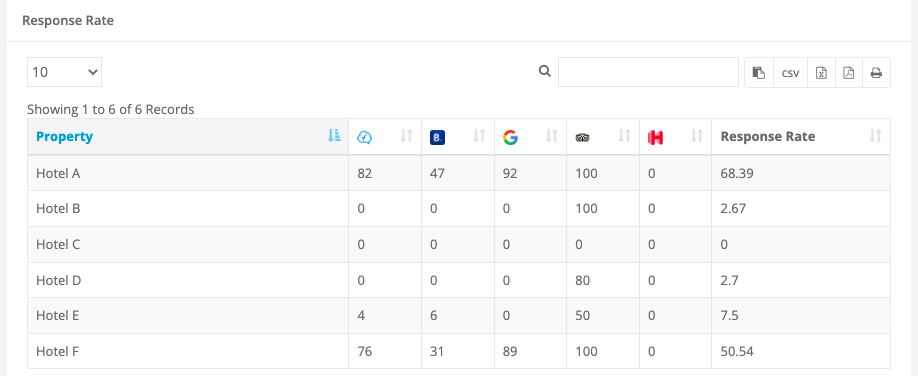
Below this, the Response Rate table will show you the response rate (percent of repliable reviews that were responded to) for each property and online channel.
Finally, there is a bar chart showing each property’s overall response rate for all sources.

Management Response Overview Report for individual accounts
If you are a single hotel or would like to look at an individual account in your group, you can also see a Management Report for that account:
- Log in to your GuestRevu account.
- Select the specific account if you manage multiple accounts.
- Go to Reports > Management Response > Overview.
Understanding your Individual Account Management Response Overview Report
The top of this page is very similar to the group report, with a couple of figures and percentages.
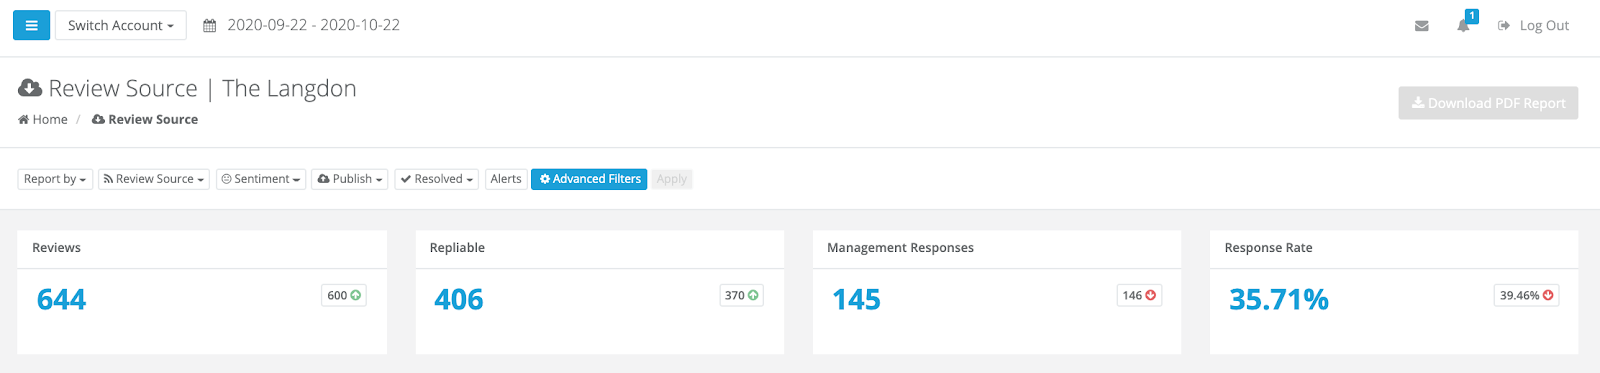
Reviews: Total number of reviews your property received within the selected date range.
Repliable: Number of reviews that can be responded to.
Management Response: Total responses published in the selected date range.
Response rate: % of repliable reviews that received responses.
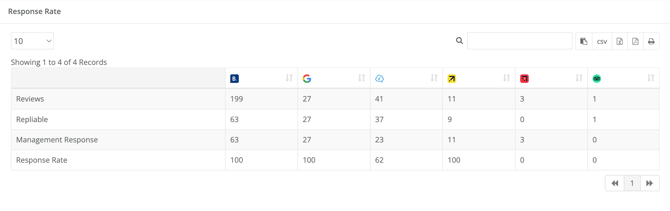
Next, you will see a table summarising your number of reviews, the number of repliable reviews, management responses and response rate per online channel.
 Reply Time Report
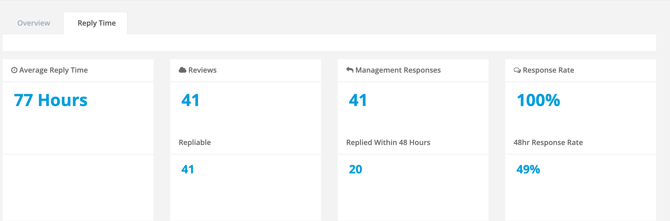
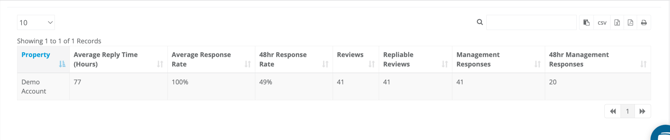
Average Reply Time: The average time responses are published.
Reviews: Number of reviews.
Repliable: Number of reviews that can be responded to.
Management Response: Total responses published in the selected date range.
Replied within 48 hours: Number of reviews that were responded to within 48 hours of the review being submitted.
Response rate: % of repliable reviews that received responses.
48-hour Response rate: % of repliable reviews that received responses within 48 hours of the review being submitted.
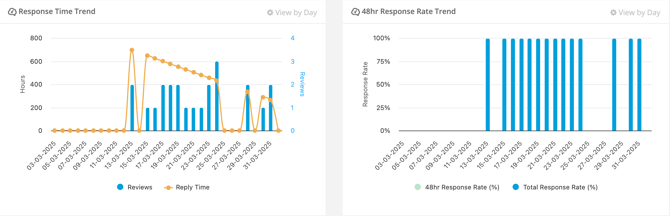
The Response Time Trend graph enables you to observe patterns in management responses by correlating the volume of reviews with the average time taken to respond.
The 48-Hour Response Rate Trend graph helps you track management response patterns within 48 hours of receiving a review. It correlates the percentage of responses published in this timeframe with the overall response rate.
The table below summarises the average reply time, repliable reviews, number of management responses, reviews replied within 48 hours, response rate and 48-hour response rate.